Pywedge Modules
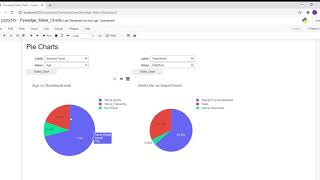
Make_Charts
Makes 8 different types of interactive Charts with interactive axis selection widgets in a single line of code for the given dataset.
Different types of Charts viz,
- Scatter Plot
- Pie Chart
- Bar Plot
- Violin Plot
- Box Plot
- Distribution Plot
- Histogram
- Correlation Plot
Arguments:
Instantiate the Pywedge_Charts class and call make_charts method from Instantiated Pywedge_Charts class object as below
mc = pw.Pywedge_Charts(df, c=None, y = 'Target col')

charts = mc.make_charts()
df= Dataframec= any redundant column to be removed (like ID column etc., at present supports a single column removal, subsequent version will provision multiple column removal requirements)y= target column name as a string
Returns:
Charts widget
Pywedge-Make_Charts Demo YouTube link below,
Please read about Pywedge-Make_Charts module in this article published in Analytics India Magazine.
Baseline_model
The baseline_model class starts with interactive pre-processing steps,
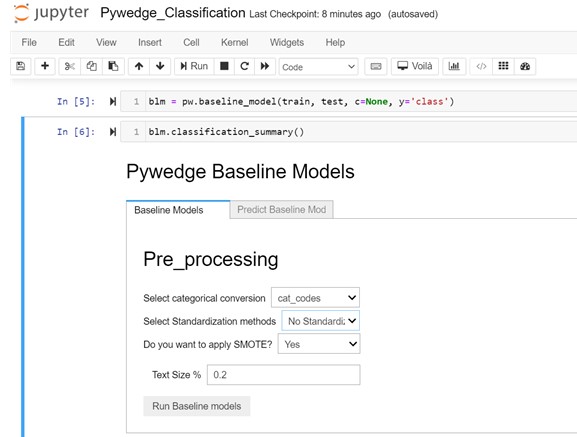
Instantiate the baseline_model class & call the classification_summary method from baseline_model class,
blm = pw.baseline_model(train, test, c, y, type)

blm.classification_summary()
- Args:
train= train dataframetest= test dataframec= any redundant column to be removed (like ID column etc., at present supports a single column removal, subsequent version will provision multiple column removal requirements)y= target column name as a stringtype= Classification(Default) / Regression
Call the following methods from Instantiated baseline_model class object,
- For classification -
classification_summary() - For Regression -
Regression_summary()
User Inputs in Interactive Tab:
- Categorical columns conversion options
- Using Pandas Catcodes
- Using Pandas Get Dummies
- Standardization Options,
- Standard scalar
- Minmax scalar
- Robust Scalar
- No Standardization
- For Classification, Class balance using SMOTE options
- Yes
- No
- Test Size for Train-test split
- test size in float
Returns:
- Baseline models tab - Various baseline model metrics
- Predict Baseline model tab - User can select the preferred available baseline choices to predict
Interactive Hyperparameter Tuning
- Introducing interactive hyperparameter tuning class,
Pywedge_HP, which has following two methods,HP_Tune_ClassificationHP_Tune_Regression
Instantiate the Pywedge_HP class & call the HP_Tune_Classification method from Pywedge_HP class,
pph = pw.Pywedge_HP(train, test, c, y, tracking=False)

pph.HP_Tune_Classification()
Args:
train= train dataframetest= test dataframec= any redundant column to be removed (like ID column etc., at present supports a single column removal, subsequent version will provision multiple column removal requirements)y= target column name as a stringtracking= True/False(Default) # set toTrueenable mlflow hyperpameter tracking
Call the following methods from Instantiated Pywedge_HP class object,
- For classification -
pph.HP_Tune_Classification() - For Regression -
pph.HP_Tune_Regression()
As seen in the above GIF, user can interactively enter hyperparameter values, without worrying about tracking the same, as the integreted MLFlow automatically takes care of tracking hyperparameter values.
Tracking Hyperparameters
Hyperparameters can be tracked on-the-go, while using Pywedge. User can seamlessly switch between the available base_estimator & set the hyperparameter search space without worrying about tracking the same.
Install mlflow, please install mlflow version 1.12.1 (in local machine or in Colab)
pip install mlfow==1.12.1
On Local Machine
To invoke mlflow tracking user interface, follow the below steps,
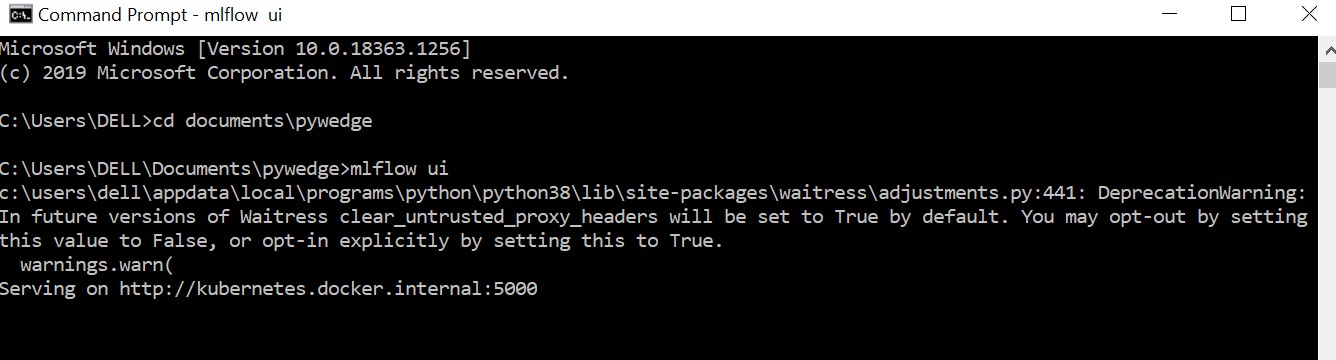
- open command prompt
- change directory to the location of the Jupyter Notebook file, for eg., if Jupyter notebook in a folder named pywedge in Documents folder
cd documents\pywedge - enter the following command
mlflow ui - which will return the URL to access the mlflow ui & typically mlflow starts in the local host 5000. Please find the below pic for reference,
On Google Colab
Hyperpameter can be tracked using MLFlow User interface in Google Colab as well, but the local host 5000 in Google colab needs to accessed through a secured tunnel, for which Pywedge provides a helper function using pyngrok.
- Install pyngrok in Colab
!pip install pyngrok[pyngrok is not a hard dependency in pywedge, it needs to be separately installed] -
Call
get_tracking_urlmethod fromPywedge_HPclass objectpph.get_tracking_url -
which will return a URL to access MLFlow user interface